
Top Essay Writers
Our top essay writers are handpicked for their degree qualification, talent and freelance know-how. Each one brings deep expertise in their chosen subjects and a solid track record in academic writing.
Simply fill out the order form with your paper’s instructions in a few easy steps. This quick process ensures you’ll be matched with an expert writer who
Can meet your papers' specific grading rubric needs. Find the best write my essay assistance for your assignments- Affordable, plagiarism-free, and on time!
Posted: May 3rd, 2023
Executive Summary
Dielectric properties are the main parameters that are used to provide data on how materials are affected and interact with electromagnetic energy such as in a microwave. This research was based on measuring the dielectric constant and dielectric loss factors of test solutions. They were measured at different frequencies to see the response. The test solutions consisted of five components that imitate those found in real life. These components of interest were Water, Carbohydrates, Protein, Salt and Fat. The experimental procedure consisted of varying the composition of the solution with the five components to observe how their dielectric properties are affected.
We get a lot of “Can you do MLA or APA?”—and yes, we can! Our writers ace every style—APA, MLA, Turabian, you name it. Tell us your preference, and we’ll format it flawlessly.
Mixture Design using Extreme Vertices was used through the Minitab Software. Mixture Design was chosen as they are a special case of Response Surface Design in which the product under investigation is made up of several component or ingredients. This design consisted of a total of 125 test runs. Each run was made up to a total of 50g sample, each with varying proportion of the 5 components. The sample was then tested using the Network Analyzer between the frequency of 300 MHz and 3 GHz.
The results obtained were then analysed and multiple regression performed. An equation to model the response to the variation in composition was constructed. The output from this equation was compared to the original experimental results using one-way ANOVA. The p-values obtained indicated the null hypothesis can be accepted. There is no difference in means between the data obtained through the experimental procedure and from the regression equations. It is recommended that further work is required to test the validity of the equation and check that it performs to a sufficient level and holds true.
Table of Contents
Totally! They’re a legit resource for sample papers to guide your work. Use them to learn structure, boost skills, and ace your grades—ethical and within the rules.
Starts at $10/page for undergrad, up to $21 for pro-level. Deadlines (3 hours to 14 days) and add-ons like VIP support adjust the cost. Discounts kick in at $500+—save more with big orders!
2.3 Factors Affecting Dielectric Properties
2.4 Effect of Sugar, Starch and Salt
100%! We encrypt everything—your details stay secret. Papers are custom, original, and yours alone, so no one will ever know you used us.
2.5 Determining Dielectric Properties
3.1 Preparation of Test Solutions
3.2 Measuring Dielectric Properties using the Network Analyzer
Nope—all human, all the time. Our writers are pros with real degrees, crafting unique papers with expertise AI can’t replicate, checked for originality.
3.3 Operation of Ultrasound Processor
4.2 Regression Analysis of Data
Our writers are degree-holding pros who tackle any topic with skill. We ensure quality with top tools and offer revisions—perfect papers, even under pressure.
4.1 Errors Introduced in Experimental Procedure
5.0 Conclusion and Future Work
Experts with degrees—many rocking Master’s or higher—who’ve crushed our rigorous tests in their fields and academic writing. They’re student-savvy pros, ready to nail your essay with precision, blending teamwork with you to match your vision perfectly. Whether it’s a tricky topic or a tight deadline, they’ve got the skills to make it shine.
Appendix A: Safety and Laboratory Use
Appendix C: Experimental Runs and Results
Appendix D: Calibration Measurement of Distilled Water
Guaranteed—100%! We write every piece from scratch—no AI, no copying—just fresh, well-researched work with proper citations, crafted by real experts. You can grab a plagiarism report to see it’s 95%+ original, giving you total peace of mind it’s one-of-a-kind and ready to impress.
Appendix E: Scatterplots of Dielectric Constant and Loss Factor
Appendix F: One-Way ANOVA Results
List of Figures
Yep—APA, Chicago, Harvard, MLA, Turabian, you name it! Our writers customize every detail to fit your assignment’s needs, ensuring it meets academic standards down to the last footnote or bibliography entry. They’re pros at making your paper look sharp and compliant, no matter the style guide.
Figure 2: Sampling Probe immersed into the test solution
For sure—you’re not locked in! Chat with your writer anytime through our handy system to update instructions, tweak the focus, or toss in new specifics, and they’ll adjust on the fly, even if they’re mid-draft. It’s all about keeping your paper exactly how you want it, hassle-free.
Figure 6: Dielectric constant of distilled water during calibrations
Figure 7: Variations during calibration of distilled water
It’s a breeze—submit your order online with a few clicks, then track progress with drafts as your writer brings it to life. Once it’s ready, download it from your account, review it, and release payment only when you’re totally satisfied—easy, affordable help whenever you need it. Plus, you can reach out to support 24/7 if you’ve got questions along the way!
List of Tables
Table 1: Composition range of the test solutions
Need it fast? We can whip up a top-quality paper in 24 hours—fully researched and polished, no corners cut. Just pick your deadline when you order, and we’ll hustle to make it happen, even for those nail-biting, last-minute turnarounds you didn’t see coming.
Table 2: Regression equations for the dielectric properties for the test solutions
Table 3: P-values from the one-way ANOVA performed with the experimental and calculated values of
ε’and
Absolutely—bring it on! Our writers, many with advanced degrees like Master’s or PhDs, thrive on challenges and dive deep into any subject, from obscure history to cutting-edge science. They’ll craft a standout paper with thorough research and clear writing, tailored to wow your professor.
Microwave Processing of food is a growing industry in the food sector. Dues to this, the dielectric properties of food have become an important parameter in food engineering. The interest in these properties are mainly focused on how they affect the heating of the food when used in a high frequency microwave. Now there is a growing sense in the food industry of using microwaves to heat food, especially commercially. The use of microwaves to heat food products offers advantages over traditional methods. These advantages include the instant heating of product, low maintenance associated with it and the ease of use.
Dielectric Properties are the main parameters that are used to provide data on how materials are affected and interact with electromagnetic energy such as in a microwave. This data is crucial in determining how food material responds to changes in frequency and temperature. Thus, dielectric properties of food have become a parameter of increasing importance in the field of food engineering and technology.
This research is based on measuring the dielectric constant and dielectric loss factors of test solutions. This will be measured at different frequencies to see the response. The test solutions will consist of five components that imitate those found in real life. These components of interest are Water, Carbohydrates, Protein, Salt and Fat. The experimental procedure will consist of varying the composition of the solution with the five components to observe how their dielectric properties are affected.
Analysis will be done on the data that is captured. An equation to model the response to the variation in composition will be constructed. This equation will then be applied to food items with known composition to test their validity against known dielectric properties.
We follow your rubric to a T—structure, evidence, tone. Editors refine it, ensuring it’s polished and ready to impress your prof.
The objective of this project is to find a model that can be used to predict the dielectric properties of food with known composition. These models will first be constructed by getting base figures form known composition.
Microwaves are electromagnetic waves within a frequency band of between 300MHz and 300GHz. They fit between radio frequency at the lower range and by infrared and visible light in the upper spectrum.
Send us your draft and goals—our editors enhance clarity, fix errors, and keep your style. You’ll get a pro-level paper fast.
Microwaves are directly adjacent to radio frequencies. This frequency is generally used for radio and television broadcast. Microwave frequency range, are also used for telecommunication purposes, such as for mobile networks, radars and wireless networks. In order to prevent contamination of the broadcasting signals and interference, certain frequency bands are reserved for Industrial, Scientific and Medical (ISM) applications. For microwaves dielectric heating purposes, these bands are 433, 915, 2450 and 5800 MHz (Watkins, 2012). Most of the domestic household microwaves operate on a frequency of 2450 MHz. Industrial microwaves operate on 915MHz frequency (Regier, Knoerzer & Schubert 2017).
With the progress in current lifestyle enjoyed by people, microwaving heating technology brings added benefits to the heating of food. These include the quick heating of food, ease of use and low maintenance associated with it. The combination of traditional method of heating (air drying) combined with microwave heating also brings added benefits to the food industry as it can reduce the processing times, energy consumption and reduce time taken to process those foods currently. However, the inconsistent heating of food associated with microwaves remains the major obstacle on fully utilising this technology (Umesh Hebbar, Rastogi 2012).
Green energy regulations call from more efficient use of energy and this is where microwave heating has an advantage over traditional means due to its minimal processing of materials. This is where it shows its potential promising future. They are also energy efficient can be used with other heating methods.
Microwave heating is a result of interactions that occur between dielectric material and electromagnetic waves. Dielectric properties govern the efficiency and quality of the heating process. An oscillating electric field, when applied to a polar dielectric material, leads to the dipoles within the material to align themselves with the field. The polarisation rate of change leads to the molecules vibrating as they re-orientate to the oscillating waves. This in effect leads to the increase in molecular kinetic energy which is then converted to heat (Meda, Orsat & Raghavan 2017).
Yep! We’ll suggest ideas tailored to your field—engaging and manageable. Pick one, and we’ll build it into a killer paper.
The dielectric properties of food that are of most interest can be defined in terms of their complex relative permittivity. It is expressed as
ε*=ε’-jε” Eq. 1
ε’
is commonly known as the dielectric constant while
ε”is the dielectric loss factor, while
j=-1. The dielectric constant
(ε’), shows the ability of a material to store energy while it is under the influence of an energy field. The loss factor
Yes! Need a quick fix? Our editors can polish your paper in hours—perfect for tight deadlines and top grades.
(ε”), affects both the energy absorption and attenuation and describe the ability to dissipate energy in response to an electric field, which commonly generates heat (Ikediala et al., 2000). The amount of thermal energy converted in food is proportional to the value of the loss factor (Tang, 2005).
This increase in temperature due to dielectric heating can be defined as
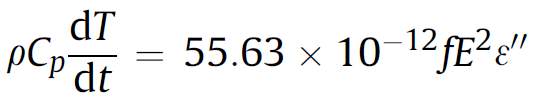 Eq. 2
Eq. 2
Where
Cp(J kg-1°C-1) is the specific heat of the material, ρ (kg m-3) is the density of the material, E (V m-1) is electrical field intensity, ƒ (Hz) is the frequency, dT/dt (°C s-1) is the time rate of temperature increase. From the equation above, it can be concluded that the increase in time is proportional to the loss factor along with the electric field intensity, frequency and the time.
Another factor that is important is the penetration depth. This is the depth of a sample where the microwave power has dropped to approximately 36.8% of its transmitted power. The penetration depth is affected by both of
Sure! We’ll sketch an outline for your approval first, ensuring the paper’s direction is spot-on before we write.
(ε”)and
(ε’)(Sosa-Morales et al., 2010).
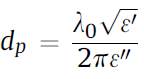 Eq. 3
Eq. 3
An alternative way of expressing this equation is
 Eq. 4
Eq. 4
Common foods have been found to have
(ε”)<25 , which implies a dp of 0.6 to 1 cm (Venkatesh, Raghavan 2004).
2.3 Factors Affecting Dielectric Properties
Definitely! Our writers can include data analysis or visuals—charts, graphs—making your paper sharp and evidence-rich.
There are several important factors which lead to changes in dielectric properties. They consist of factors which relate to the nature of the product (composition, structure) while others are to do conditions when it is heated (temperature, frequency).
Dielectric constants are dependent of the chemical composition of the material. In food generally, it is mostly made of water and its content has a direct effect on heating. Water is the major absorber of the microwave energy in foods and due to this, the higher the water content, the better the heating (Venkatesh, Raghavan 2004). Ionic compounds such as salt also has a vast effect on these properties. Increasing of salt content from 0.8% to 2.8%, resulted in an increase in loss factor of mashed potatoes, while the dielectric constant was not affected (UAN et al., 2004).
With the exception of some materials that absorb no energy from microwaves, the dielectric properties of food vary with frequency. This is due to the polarisation of molecules that occur when an electrical field is applied. The molecules in the food oscillate to align with the electrical field applied. This oscillation in turn leads to an increase in kinetic energy which is then converted to heat. Thus, as the frequency is increased, this also leads to the heating done on the material (Meda et al., 2017).
2.4 Effect of Sugar, Starch and Salt
There has been various past research and measurements done on the effect of Sugar on dielectric properties. A past research done on measurement of sucrose, glucose and syrup found that frequency and concentration of the solution led to the varying of the complex permittivity (Kent, Kress-Rogers 1986). There was a great difference of values measured at 3.05 GHz and 2.8 GHz.
Starch containing solutions with up to 40% water was also tested. This carbohydrate-water mixture contained potato and wheat starch. The value of dielectric constant was found to be higher for potato starch than that of wheat starch at 10 GHz. The value of the loss factor for the potato starch is lower. It was also found that the loss factor for most starches decreased due to heating (Miller, Gordon & Davis 1991).
Salt ions have a great impact on the dielectric properties of food. The dielectric loss factor is increases with temperature as frequencies below 200 MHz. Increasing temperature leads to a reduction in dielectric loss factor between 200 MHz and 10 GHz (UAN et al., 2004, Gavish, Promislow 2016).
2.5 Determining Dielectric Properties
There are a few different ways of determining the dielectric properties. The main factors that lead to consideration of the method is the type of material, the required frequency range and accuracy, and availability and cost of equipment.
The three most popular methods of measuring the dielectric properties of food are open-ended coaxial probe, transmission line and, resonant cavity method. The probe method is based on a coaxial line that ends and makes contact with the material being tested. This method is the simplest to use and it doesn’t require the tested material to be of a particular size or shape or special containers (Ikediala et al., 2000).
We’ve got it—each section delivered on time, cohesive and high-quality. We’ll manage the whole journey for you.
The transmission line involves placing the testing sample inside a transmission line. This requires the cross section of the line to be filled with the sample precisely. This method is time consuming but is very accurate and sensitive in its measurement (Kudra et al., 1992). The cavity method involves a sample of known geometry to be placed in a cavity. It can be used to gauge accurate results and is useful for samples with low dielectric loss factor. A main concern is that this method can only be used to measure at a set frequency during each run.
The five components used to make up the test solutions consisted of Water (Distilled Water), Carbohydrates (Sugar), Protein (Whey Protein), Salt (Table Salt) and Fat (Canola Oil). The experiments consisted of varying the composition of the test solutions and recording their reading of dielectric constant and loss factor. The composition range of the five components were selected as shown in Table 1. These values were selected based on average food compositions (Sivakumaran, Huffman & Sivakumaran 2017).
Table 1: Composition range of the test solutions
| Component | Lower | Upper |
| Water | 30% | 80% |
| Carbohydrates (Sugar) | 0% | 60% |
| Protein | 0% | 20% |
| Fat (Oil) | 0% | 50% |
| Salt | 0% | 1% |
For the experiments, Mixture Design using Extreme Vertices was used through the Minitab Software. Mixture Design was chosen as they are a special case of Response Surface Design in which the product under investigation is made up of several component or ingredients. As the five components used in this experiment have to create a total mixture amount of 100%, Mixture Design was found to be the best fit experimental design. Due to the setting of lower and upper bounds of the component, Extreme Vertices Design was best suited for this design. As noted in Appendix B, the Mixture Design consist of a total of 125 runs.
Yes! UK, US, or Aussie standards—we’ll tailor your paper to fit your school’s norms perfectly.
The test solutions were made to be a total of 50g. The values of the component in each run is shown in Appendix C.
3.1 Preparation of Test Solutions
The solutions were all prepared in a jar before being tested. The jar was first tare weighed. Water was first weighed out onto the jar according to the required amount for the set run. This was followed by sugar, if it was required, on a sheet and then added to the jar. To assist in dissolving of the sugar particles, this solution was placed in a water bath with a set temperature of 40°C. Once the solution was dissolved, salt was then weighed out and added. Once dissolved, whey powder was weighed and added. This process was repeated with oil. Weighing of the materials were all done on the scales. The heat bath was set to a max of 40°C as protein enzymes begin to degrade at this temperature (Ferguson, Lurie & Bowen 1994). The temperature of the solution was checked to ensure it was below this temperature before any protein powder was added.
For solutions that did not contain oil, the solution was mixed only by hand shaking of the jar. This was done sufficiently to dissolve all particles of the solution. As oil is immiscible in water, for solutions that contained oil, further mixing was performed using an ultrasound processor.
3.2 Measuring Dielectric Properties using the Network Analyzer
If your assignment needs a writer with some niche know-how, we call it complex. For these, we tap into our pool of narrow-field specialists, who charge a bit more than our standard writers. That means we might add up to 20% to your original order price. Subjects like finance, architecture, engineering, IT, chemistry, physics, and a few others fall into this bucket—you’ll see a little note about it under the discipline field when you’re filling out the form. If you pick “Other” as your discipline, our support team will take a look too. If they think it’s tricky, that same 20% bump might apply. We’ll keep you in the loop either way!
The dielectric properties of the test solutions were all measured using the dielectric probe kit. This kit consists of an open-ended coaxial probe (Model 85070E, Agilent Technologies) that is connected to network analyzer (E5062A ENA Series Network Analyzer, Agilent Technologies). The network analyser once started was left to stabilise for an hour. Then the probe was attached to the network analyser and the measuring probe was attached to the measuring stand. Calibration of the probe was then performed. Calibration involved a three-step process involving open air, short circuit and lastly 25°C distilled water. Calibration was performed for the frequencies between 300MHz and 3GHz.
Open-ended coaxial probe
Network Analyser
Our writers come from all corners of the globe, and we’re picky about who we bring on board. They’ve passed tough tests in English and their subject areas, and we’ve checked their IDs to confirm they’ve got a master’s or PhD. Plus, we run training sessions on formatting and academic writing to keep their skills sharp. You’ll get to chat with your writer through a handy messenger on your personal order page. We’ll shoot you an email when new messages pop up, but it’s a good idea to swing by your page now and then so you don’t miss anything important from them.
Sampling beaker being tested
Figure 1: Layout of the equipment during the third stage of calibration and normal testing of samples
Occasionally, after calibration, the reading of the Distilled water would fluctuate as seen in Appendix D. When this occurred, the system was recalibrated until a smooth consistent curve was realised.
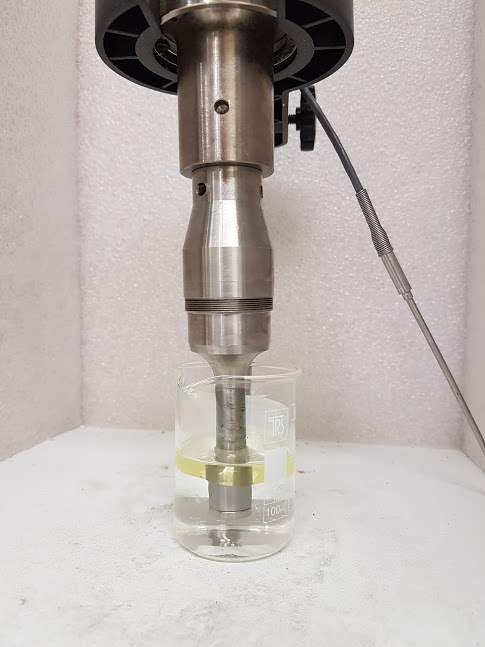
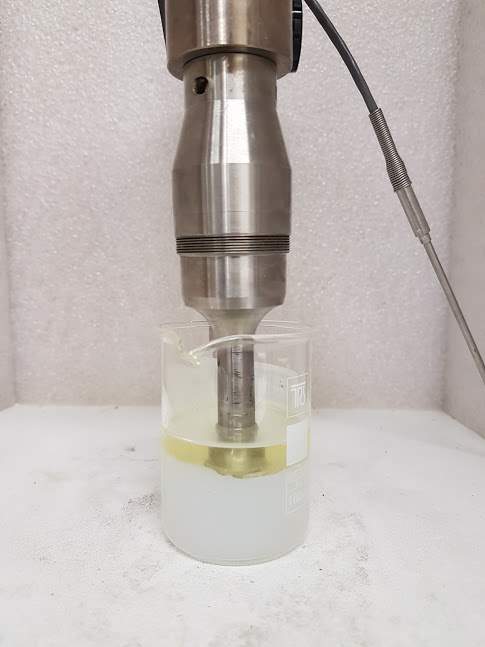
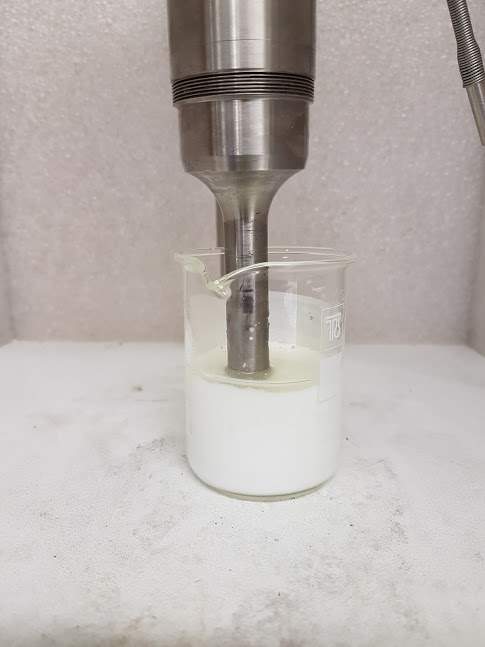
A 10mL sample was poured into a sampling beaker. The measuring probe was lowered to be fully immersed into the sample to be at least half submerged as seen in Fig. 2. The measurement was immediately triggered and a recording output was given. The temperature of the test solution was ensured to be between 20°C and 25°C before it was poured into the sample beaker. This was to ensure all reading were recorded at a similar temperature and avoid any fluctuations in readings.
Figure 2: Sampling Probe immersed into the test solution
Between samples, the probe was cleaned with distilled water and then pat dried. When a solution with oil was measured, care was taken to clean the probe thoroughly. This was firstly done by use of Ethanol to cleanse any oil residues. The probe was then cleaned with distilled water and pat dried. As Ethanol was used, this could affect any new readings so recalibration had to be done on the unit. To reduce the time delay caused by the recalibration, the decision was made to test blocks of samples with oil in its composition. This ensured that the use of ethanol was not required to clean the probe for the consecutive samples and thus avoid the delay of recalibration.
3.3 Operation of Ultrasound Processor
The Ultrasound has the ability to be able to input time, temperature control, pulses, amplitude and energy input. Approximately 50mL of the test solution was poured into a beaker. The ultrasound mixer probe was lowered halfway into the solution. The processor was turned on. The time for mixing, maximum temperature and pulses were selected. The processor was then started until the solution was mixed to a homogenous solution.
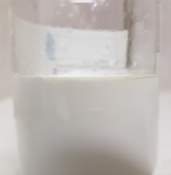
As the ultrasound processor has an effect of heating up the solution as it operates, care had to be taken to monitor the temperature. To reduce the risk of overheating, the beaker that held the sample was placed in a larger dish with an ice and cold-water mixture. This helped to keep the temperature of the solution fairly consistent as the processor operated. As seen in Appendix E, there was a slow change from separate layers of water and oil to a homogenous solution.
(b)
(a)
(c)
(d)
Figure 3: Mixing of Run 74. Consisting of 40g water and 10g oil. Pictures were taken at start (a), after 90 secs (b), after 360 secs (c) and after 720 secs (d)
Figure 4: Cox Response Trace Plot showing the effect of components composition at 915MHz and 2450MHz on the dielectric constant
As seen in Fig. 3 for both frequencies, there is a similar change in dielectric constant as a result of proportion change of the components. As the proportion of Water increases at both frequencies, so does
ε’. For Carbohydrates, the change in concentration follows a concave function. Initially
ε’is low and rises as the concentration increases. At a certain proportion, approximately 0.25,
ε’starts to decrease. For Protein, there is a slight decrease in the value of
ε’as its proportion increases. With Fat, there is a large decrease in the
ε’reading as the fat proportion increases. For Salt there is a sharp decrease in
ε’as the proportion of salt increases. These trends are comparable to the scatter plot of
ε’against the five components proportion as shown in Appendix E.
The increase in water content in the test solutions leading to an increase in dielectric constant is consistent with what is expected in literature. It has been noted that higher moisture content leads to a higher loss factor (Komarov, V., Wang, S., & Tang, J, 2005). Higher water content leads to better heating in food. This is due to water absorbing majority of the energy in microwave heating. Microwave heating and thus dielectric constant is greatly affected by water (Nelson, Kraszewski 1990).
Figure 5: Cox Response Trace Plot showing the effect of components composition at 915MHz and 2450MHz on the loss factor
For the Loss Factor in regards to Water as seen in Fig. 4, there is a convex function relationship.
ε”initially rises but then starts decreasing for both frequencies. For carbohydrates, at 915 MHz, there is a concave relationship between the loss factor and increase in proportion of carbohydrates. At 2450 MHz, there is an almost linear relationship. Increase of fat concentration leads to a decrease in loss factor at both frequencies. Protein also exhibits different relationships at different frequencies. At 915 MHz, there is a slight concave function to the relationship. During 2450 MHz, there is a decrease in the loss factor as the proportion of protein increases. As the salt proportion increases there is a dramatic increase in loss at both frequencies. The gradient increase at 915 MHz is much higher. These trends are comparable to the scatter plot of
ε”against the five components proportion as shown in Appendix E where the degree of relationship is not as clear.
The increasing proportion of salt having a sharp increase in
ε”was consistent with a previously run experiment reported by (UAN et al., 2004). Salts or dissolved ions lead to reduction in polarisation of water and
ε’by binding water.
4.2 Regression Analysis of Data
Regression Analysis was performed on the data that was gathered from the experiment procedures. This was done for the dielectric constant and loss factor for both 915 MHz and 2450 Mhz. This was done to arrive at an equitation that would enable us to predict the dielectric constant and loss factor of any substance that had its composition available. Table 2 details the equations that were achieved for
ε’and
ε”.
Table 2: Regression equations for the dielectric properties for the test solutions
| Dielectric Constant ( |
You Want The Best Grades and That’s What We Deliver
Our top essay writers are handpicked for their degree qualification, talent and freelance know-how. Each one brings deep expertise in their chosen subjects and a solid track record in academic writing.
We offer the lowest possible pricing for each research paper while still providing the best writers;no compromise on quality. Our costs are fair and reasonable to college students compared to other custom writing services.
You’ll never get a paper from us with plagiarism or that robotic AI feel. We carefully research, write, cite and check every final draft before sending it your way.