
Top Essay Writers
Our top essay writers are handpicked for their degree qualification, talent and freelance know-how. Each one brings deep expertise in their chosen subjects and a solid track record in academic writing.
Simply fill out the order form with your paper’s instructions in a few easy steps. This quick process ensures you’ll be matched with an expert writer who
Can meet your papers' specific grading rubric needs. Find the best write my essay assistance for your assignments- Affordable, plagiarism-free, and on time!
Posted: October 28th, 2024
Executive Summary
This report is about big data concepts and the technologies used in big data. There are three tasks presented in this report with big data being the central aspect of all discussions.
The first part of the report is on data mining aspect of big data. Predictive analysis is performed on a large weather data set to predict if there will be rain tomorrow. The analysis is performed using RapidMiner software tool. The outcome of the use of RapidMiner is to apply statistical techniques, predictive modelling and machine learning techniques on the dataset in the prediction of rainfall. This kind of predictive analysis about the weather condition is helpful for weather depended companies like construction company so that they can manage their inventory, meet their labour needs, handle their supply chain, keep their people safe and delivery their promises to their clients.
The second task of the report discusses about the components of a proposed big data architecture for a government owned water utility company. The architecture covers the big data technologies used to handle data having characteristics like big volume, greater velocity, exhibiting large data variability. The proposed architecture provides the necessary IT infrastructure to help the company in its overall operations with its revenue loss due to incorrect billing, theft, outage and demand predictions and better customer service. The report also covers literature surrounding the privacy, security and ethical concerns of the big data usage.
Yes, completely! They’re a valid tool for getting sample papers to boost your own writing skills, and there’s nothing shady about that. Use them right—like a study guide or a model to learn from—and they’re a smart, ethical way to level up your grades without breaking any rules.
The last task of the report is use of visualization tool Tableau to create reports on Aviation Wildlife Strike. Interactive report is created to answer questions about the about hidden facts from the available data. The report gives insights about the cost of the wild life strikes, the strikes distributed during the time of day, damage caused to aircraft and to humans. The information is helpful for the airlines to understand the shortcomings of the existing systems and improve their operation efficiency.
The report in its concise format provides information on handling big data in a systematic way providing the learner a perfect platform to understand big data and its applications in real world.
Contents
Prices start at $10 per page for undergrad work and go up to $21 for advanced levels, depending on urgency and any extras you toss in. Deadlines range from a lightning-fast 3 hours to a chill 14 days—plenty of wiggle room there! Plus, if you’re ordering big, you’ll snag 5-10% off, making it easier on your wallet while still getting top-notch quality.
Exploratory Data Analysis of Weather Data
Nope—your secret’s locked down tight. We encrypt all your data with top-tier security, and every paper’s crafted fresh just for you, run through originality checks to prove it’s one-of-a-kind. No one—professors, classmates, or anyone—will ever know you teamed up with us, guaranteed.
Relationship between the variables using Scatter Plot diagram
Chi Squared Test Analysis and Output
Top five significant variables
Not even a little—our writers are real-deal experts with degrees, crafting every paper by hand with care and know-how. No AI shortcuts here; it’s all human skill, backed by thorough research and double-checked for uniqueness. You’re getting authentic work that stands out for all the right reasons.
Our writers are Ph.D.-level pros who live for nailing the details—think deep research and razor-sharp arguments. We pair that with top plagiarism tools, free revisions to tweak anything you need, and fast turnarounds that don’t skimp on quality. Your research paper won’t just shine—it’ll set the bar.
The Logistic Regression processes
You’re in good hands with degree-holding pros—many rocking Master’s or higher—who’ve crushed our tough vetting tests in writing and their fields. They’re your partners in this, hitting tight deadlines and academic standards with ease, all while tailoring every essay to your exact needs. No matter the topic, they’ve got the chops to make it stellar.
100%—we promise! Every paper’s written fresh from scratch—no AI, no copying—just solid research and proper citations from our expert writers. You can even request a plagiarism report to see it’s 95%+ unique, giving you total confidence it’s submission-ready and one-of-a-kind.
Lift Chart for Decision Tree model
Logistic Regression Validation
Yep—APA, Turabian, IEEE, Chicago, MLA, whatever you throw at us! Our writers nail every detail of your chosen style, matching your guidelines down to the last comma and period. It’s all about making sure your paper fits academic expectations perfectly, no sweat.
ROC (Receiver Operating Characteristic) analysis for Logistic Regression
Lift Chart for Logistic Regression Model
Absolutely—life happens, and we’re flexible! Chat with your writer anytime through our system to update details, tweak the focus, or add new requirements, and they’ll pivot fast to keep your paper on point. It’s all about making sure the final draft is exactly what you need, no stress involved.
Enterprise Data Warehouse (EDW) Architecture of a water utility company
It’s super easy—order online with a few clicks, then track progress with drafts as your writer works their magic. Once it’s done, download it from your account, give it a once-over, and release payment only when you’re thrilled with the result. It’s fast, affordable, and built with students like you in mind!
Component description of the proposed architecture
We can crank out a killer paper in 24 hours—quality locked in, no shortcuts. Just set your deadline when you order, and our pros will hustle to deliver, even if you’re racing the clock. Perfect for those last-minute crunches without compromising on the good stuff.
Security Privacy and Ethical Concerns when using Big Data platform
For sure! Our writers with advanced degrees dive into any topic—think quantum physics or medieval lit—with deep research and clear, sharp writing. They’ll tailor it to your academic level, ensuring it’s thorough yet easy to follow, no matter how tricky the subject gets.
Impact of wildlife strikes with aircraft over time for a specific origin state
Wildlife Strikes by flight of phase and time of the day
Damage Caused by Wildlife Species to Aircrafts
We stick to your rubric like glue—nailing the structure, depth, and tone your professor wants—then polish it with edits for that extra shine. Our writers know what profs look for, and we double-check every detail to make sure it’s submission-ready and grade-worthy.
Damage caused to Aircraft in different state
Interactive Dashboard on Wildlife Strike
Send us your draft and tell us your goals—we’ll refine it, tightening arguments and boosting clarity while keeping your unique voice intact. Our editors work fast, delivering pro-level results that make your paper pop, whether it’s a light touch-up or a deeper rework.
RapidMiner is a software platform for data mining. This software is used for data preparation, machine learning and predictive model deployment. Predictive analysis is done to know if there will be rain tomorrow using the data provided in the dataset.
Process: To start with the EDA process, the first step is to upload the data set to the rapid miner and then connect its output node to the resulting node of result.
Fig 1 EDA process diagram
Yes—we’ve got your back! We’ll brainstorm fresh, workable ideas tailored to your assignment, picking ones that spark interest and fit the scope. You choose the winner, and we’ll turn it into a standout paper that’s all yours.
Findings of EDA Analysis
| Attributes | Min/ Least | Max | Average | Standard Deviation | Most Frequent | Missing Values | Inconsistency |
| MinTemp | -8.5 | 33.9 | 12.16 | 6.394 | 1665 | ||
| MaxTemp | -4.8 | 48.1 | 23.19 | 7.135 | 1465 | ||
| Rainfall | 99.2 | 0 (86311) | NA (3530) | ||||
| Evaporation | 86.2 | NA (58198) | |||||
| Sunshine | 14.5 | NA (64534) | NA (64534) | ||||
| WindGustDir | NNE (6260) | NA (9871) | NA (9871) | ||||
| WindGustSpeed | 6 | NA (9980) | NA (9980) | ||||
| WindDir9am | WSW (6689) | N (11339) | NA (9980) | ||||
| WindDir3pm | NA (3884) | SE (10227) | NA (3884) | ||||
| WindSpeed9am | 83 | 9(12844) | NA (1728) | ||||
| WindSpeed3pm | 87 | 17 (11917) | NA (2762) | ||||
| Humidity9am | 0 | 100 | 68.676 | 19.038 | 2821 | ||
| Humidity3pm | 0 | 100 | 51.463 | 20.808 | 4891 | ||
| Pressure9am | 980.5 | 1041 | 1017.56 | 7.10 | 14603 | ||
| Pressure3pm | 977.1 | 1039.6 | 1015.16 | 7.03 | 14567 | ||
| Cloud9am | 9 | NA (52804) | |||||
| Cloud3pm | 9 | NA (55717) | |||||
| Temp9am | -7.2 | 40.2 | 16.983 | 6.498 | 1997 | ||
| Temp3pm | -5.4 | 46.1 | 21.657 | 6.950 | 3441 | ||
| Rain Today | NA (3530) | NO (104498) | NA (3530) |
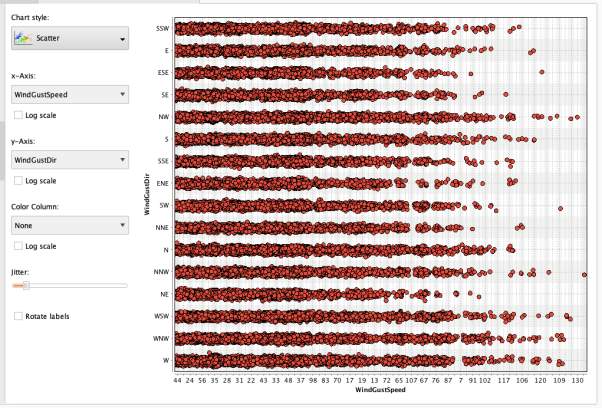
Fig 1.1 Relation between Wind Gust Speed and Wind Direction
Fig 1.2 Relation between WindSpeed at two different time of a day
Fig 1.3 Relationship between Evaporation and WindDir3pm
Yep—need changes fast? We’ll jump on your paper and polish it up in hours, fixing whatever needs tweaking so it’s ready to submit with zero stress. Just let us know what’s off, and we’ll make it right, pronto.

Fig 1.4 Variables for Analysis
The top five variables chosen for this analysis are Evaporation, WindDir3pm, WindDir9m, Windspeed3pm, WindGustDir
These five variables are selected based on weight by Chi Squared Statistical tool.
Evaporation is the process of converting water in vapor. When evaporation rate is high, there is higher chance of rain as the atmosphere is loaded with humidity.
Sure thing! We’ll whip up a clear outline to map out your paper’s flow—key points, structure, all of it—so you can sign off before we dive in. It’s a handy way to keep everything aligned with your vision from the start.
Wind Direction at different times of the day is also important to determine the chance of rain. As the weather data set has cities from Australia which is a largest island continent, the wind direction is important parameter to determine the possibility of rain. If the wind has passed over sea or any large river, it will pick up more moisture, which could bring rain. If the wind has passed over dry, hot land terrains, the air will be hot and dry and the chance of rain is nil. Wind direction changes caused weather changes.
Windspeed is the result of the difference in air pressure. The lesser the air pressure, the greater the windspeed. Windspeed is measured in kilometres per hour as per Australian Government Meteorology Department and is expressed in knots for aviation use.
Wind gust can be described as the sudden increase in the windspeed followed by a lull. Information on the wind speed and direction provides clues to predict weather.
Decision Tree Model machine learning technique is carried out on the clean weather dataset. The five variables discussed in task 1.1 is selected and the Decision Tree process is run.
Fig1.5 Decision Tree Process
Fig 1.6 Decision Tree Diagram
Absolutely—we’ll weave in sharp analysis or eye-catching visuals like stats and charts to level up your paper. Whether it’s crunching numbers or designing a graph, our writers make it professional and impactful, tailored to your topic.
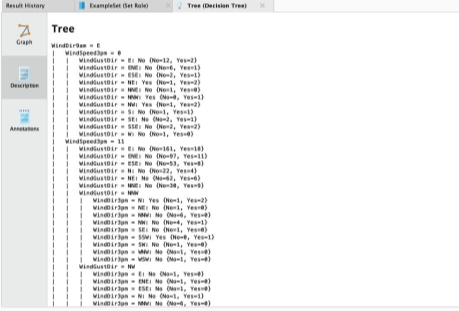
Fig 1.7 Decision Tree Rules
The decision tree model predicts there will be no rain tomorrow based on 138307 examples of the selected attributes, the least number of examples predicted Yes for rain tomorrow is 30283 and the 108024 examples were predicted NO for rain tomorrow.
Logistics Regression is regression analysis tool used to conduct the analysis on the given weather data set, the numerical attributes are converted to polynomial and then to binominal.
The clean data set is used. Select attribute operator is used to select the top five attributes (on basis of chi square). Then Nominal to Binomial operator is used to convert the nominal values of attribute selected to the binomial as logistic regression supports the binomial attributes. Set role operator is used with Rain Tomorrow as label attribute. Then the logistic regression model is used and its mode, example set, weight and threshold node are being connected with the resulting nodes of process to view the predictions of logistic regression model.
Fig 1.8 Logistic Regression Process

Fig 1.9 Result of logistic regression model
We tackle each chunk with precision, keeping quality consistent and deadlines on track from start to finish. Whether it’s a dissertation or a multi-part essay, we stay in sync with you, delivering top-notch work every step of the way.

Fig 2 Logistic Regression Ratios

Fig 2.1 Cross Validation Process
Yes—we’ve got it down! Our writers switch seamlessly between UK, US, Australian, or any other standards, matching your school’s exact expectations. Your paper will feel native to your system, polished and ready for wherever you’re studying.

Fig 2.2 Decision Tree Accuracy

Fig 2.3 ROC curve
Lift Chart for Decision Tree model 
Progressive delivery is a cool option where we send your paper in chunks—perfect for big projects like theses or dissertations. You can even pay for it in installments. It’s just 10% extra on your order price, but the perks are worth it. You’ll stay in closer touch with your writer and can give feedback on each part before they move to the next. That way, you’re in the driver’s seat, making sure everything lines up with what you need. It saves time too—your writer can tweak things based on your notes without having to redo huge sections later.
Fig 2.4 Lift Chart Result

Fig 2.5 Cross Validation Process
Absolutely! If your teacher’s got feedback, you can request a free revision within 7 days of approving your paper—just hit the revision request button on your personal order page. Want a different writer to take a crack at it? You can ask for that too, though we might need an extra 12 hours to line someone up. After that 7-day window, free revisions wrap up, but you can still go for a paid minor or major revision (details are on your order page). What if I’m not satisfied with my order? If your paper needs some tweaks, you’ve got that free 7-day revision window after approval—just use the “Revision” button on your page. Once those 7 days are up, paid revision options kick in, and the cost depends on how much needs fixing. Chat with our support team to figure out the best way forward. If you feel the writer missed the mark on your instructions and the quality’s off, let us know—we’ll dig in and sort it out. If revisions don’t cut it, you can ask for a refund. Our dispute team will look into it and figure out what we can offer. Check out our money-back guarantee page for the full scoop.

Fig 2.6 Model Accuracy Result

Fig 2.7 Confusion Matrix

Fig 2.8 ROC Analysis Output

Fig 2.9 Lift Chart
Based on the above analysis, the logistic regression model is more appropriate in the prediction of rain tomorrow. The model gives a large number of sample set 108024 as true negative which indicates it will definitely not rain tomorrow.
The state-owned water company manages and provides water services to 1.3 million consumers in the industrial and domestic area. As it is a state-owned company it is the largest distributor of water delivering 0.4 million cubic meters of water per day through a water network length measuring 5000 KM and 2000 km of connections having more than 100,000 fittings, valves and controls. There are 34 pumping stations, 180 medium and large reservoirs and tanks. The company process 0.10 million cubic meters of waste water per day, Waste water network length is 2000 KM.
The role of the EDW is to integrate the data across the operational system which may be in the operational silos as well as distributed geographically. The EDW of this water utility company includes the large volumes of data sources, data process systems, data analysis and reporting, data ware house, data marts, big data analytical applications and tools.
 Data Flow

 Process Flow
Data Sources: Huge amount of data is generated real time in water utility company from sensors and meter readings, telemeters which is a part of data from IoT. This data is part of Online Transactional Processing System. An example of Real-time data sources in water utility industry is water pressures data that is collected every 10 seconds and which is refreshed every 30 seconds. Data from sensors and actuators also constitute real time data. Customer information, their interactions, water usage, new connection requests, billing, customer complaint data from consumer information system (CIS) and the data collected throughout the life cycle of the customer is part of the Customer relationship management CRM data.
ERP data of the state utility company includes data from the Human Resources department, Supply chain management data like water quality, work orders, raw water in reservoirs and canals, water distribution, rainfall data, sales and marketing data, supervisory control and data acquisition (SCADA) system, regulatory data in a laboratory information management system (LIMS), data from surveys, social media data, data about losses due to leakage, grid data, data on Incorrect billing (inaccurate metering, data handling errors), Frauds, evaporative losses, waste water generation is also a part of ERP systems. There is also the Historical Data about the past events and Asset management data of the water utility company which is data about the pipes, pumps, their maintenance information, inventory data, manuals, diagrams, standards, references, Operating and maintenance costs, Revaluations, Warranty and Insurance, Budgets. Data from Remote Sensing, Geographic Information Systems, Global positioning system, sensor networks, scientific research projects are some of the data sources that are very unique to the water utility industry. Unstructured data such as emails, instant messages, images, videos and social media post is also a source of data for the water company.
Data Storage: Data is stored on-premises in a Hadoop Distributed File System (HDFS) that can hold big volumes of large files in different formats. In addition to this, the company also uses Cloud Services to store its data. Cloud storage vendor Windows Azure Storage Blob (WASB) is providing support to company by offering endless storage space for the huge data in its native format and this can be scalable at any time. Some other examples of cloud service providers are Microsoft ADLS, AWS S3 and Google cloud storage.
Extraction Transformation Load Process: Large volume of data generated from connected devices and sensors is captured, stored and processed using Hadoop. Hadoop combines data from various data sources as discussed above, which is in different formats. Apache NiFi recognizes all of those sources and moves the data to a central repository for storage and analysis both in real-time and batch processing. XML allows integration of data from data source to relational databases by tagging the data right when the data is created or at a later stage. This integration allows end users to access to information from the data. For example, data from GIS-based applications is integrated in XML format to provide a unified view which can accessed on web services. In the staging process the data is stored in NoSQL database.
The data from sensors and other telemeter devices is streaming at a high velocity and it is data in-motion. This real-time data ingestion in the architecture is performed by Microsoft Azure Event Hubs, Kafka. These softwarecaptures and store the data in a folder for stream processing by acting as a buffer for message ingestion, message queuing.
One example of Real-time data processing use in the water utility company is to monitor Water Quality parameter profiles like the concentration of Nitrate over time to determine the travel time between sites. This will show the water age in real-time. The information from this can be also be used to verify hydraulic model.
Batch Processing of data is performed to generate daily, weekly, monthly reports in the utility company. Big data files are processed to prepare these reports. The solutions offered by Azure Data Lake Analytics use Hive, Pig, MapReduce in the Hadoop cluster to read the source data, filter, aggregate and prepare the data for analysis.
Stream Processing: After ingestion of real-time data Apache streaming technologies like Storm and Spark Streaming in used in the Hadoop cluster for the stream analysis of data. SQL queries are run on the large set of data to prepare data for analysis. The data can be used to generate ad hoc reports, helps to determine the unseen relationships and causes like fraud detection, help to establish KPIs and benchmarking process to run the water plant.
Machine Learning: The information hidden in the data is discovered by statistical analysis. Some example of machine learning is Classification, Validation, Supervised and unsupervised methods of machine learning. Neural Network model is a machine learning technique used by water utility industry to assess water quality in water distribution network, or the river flow forecasting, water demand prediction.
Data ware house: Data ware house is the federated repository for the data collected by the number of operations in the ELT stage. It is a single source of truth. The technology used in Big Data warehouse is Hadoop MapReduce and Hadoop YARN as execution engines, the Hadoop Distributed File System (HDFS), and HBase as replacement for BigTable. Cassandara is a distributed data management system, Zookeeper is a high-performance coordination service for distributed applications, Pig and Hive for data warehousing, and Mahout for scalable machine. Pig is used as a scripting platform and Hive adds structure to the data as it is a simple SQL language used to query data.
Data marts:This component of the architecture is the subset of the data warehouse and the structure and pattern of these data marts is specific to the data ware house environment and these data marts are primary used by regional offices of the utility company. The data marts retrieve the data which maybe a requirement of a single functional area of a specific department of the utility company.
Data Orchestration: Orchestration technology such Apache Oozie and Sqoop is used in big data architecture to automate processes like repeated data processing operations, to encapsulate workflows, data transformation, data movement between multiple sources, sinks and loads the processed data into an analytical data store, or push the results straight to a report or dashboard.
Analysis and reporting: The vast amount of data which runs is petabyte is analysed using data modelling layer, such as a multidimensional OLAP cube or tabular data model in Azure Analysis Services. It also supports self-service BI, using the modelling and visualization technologies in Microsoft Power BI or Microsoft Excel. Analysis and reporting is also in the form of interactive data exploration by data scientists or data analysts. Visualization tools like Tableau, Jaspsersoft, Qlik, Power BI, open source like GIS/ spatial, plot.ly help to generate interactive dashboards to analyse the hidden data, providing meaningful reports across the organization. These tools help to visualize near-real time data to check billing irregularities, service areas, ad hoc reports for middle management team.
Data Orchestration: Orchestration technology such Apache Oozie and Sqoop is used in big data architecture to automate processes like repeated data processing operations, to encapsulate workflows, data transformation, data movement between multiple sources, sinks and loads the processed data into an analytical data store, or push the results straight to a report or dashboard.
The proposed big data architecture will boost the company performance as it will help the company to manage its big data in an efficient way. Batch processing can be performed on data sources at rest, for data in motion real-time processing will give the needful insights. The available data can be explored in many ways for predictive analysis and machine learning techniques can be applied to oversee the operations of the company.
The key security, privacy and ethical concerns associated in water utility company called Watercare is discussed below. This company collects, store, and analyse large quantities of data about customers’ locations, billing, online transactions, usage patterns, interests, demographics, and more.
Security Recognizing and specifying the exact location of the processing data is a security problem and leads to regulation breaches. This is primarily because the big data concept is based on parallelism and large amount of data is stored in random distribution in different clusters. Cyber security breaches have known to occur where hackers breached the security of the Watercare company and tampered with critical systems to control water flow. The Watercare company has data worth more than $40 million which the cyber-criminal is trying to exploit. The access to this information can lead to the theft or loss of data and damage to internal business systems and customer-facing platforms. The cyber-attack inhibits the company from conducting business as its communication is shut down. Another threat is the business email scam, whereby a criminal pretends to be a from the company directing customers to transfer funds electronically to a seemingly legitimate account which is actually not. Hackers can also remotely gain access to water pumps and manipulate the movement and treatment of the water to cause disruption to the service. The security breaches can be financially motivated, also, there is greater possibility of an angry or dissatisfied employee, customer or even competitor, having the capability to disrupt operations through a cyber-attack. Watercare company has made the cyber security awareness programme compulsory in its company in order to equip employees with better understanding about cyber security. The call centre staff, field engineers, operations teams engage with external networks on a daily basis. These people are trained to identify cyber security threats and take it as their responsibility to flag it and to know to how manage that risk. Watercare company keeps access to their SCADA systems very secure to avoid security breaches. Technicians, engineers, and operational decision-makers are given access to SCADA network based on their work role profile. No access is given to this system just for the convenience sake for convenience. This reduces vulnerabilities to cyber-attacks. Watercare company is very protective of the information that goes of its company. Steps are taken to reduces vulnerability to cyber-attacks by not positing any detailed information of its utility consultants and contractors, employee names and email addresses, treatment facilities or any other information related to its assets, description of any of its projects involving large capitals.
Privacy is a major issueassociated with the big data analytics. Big data technologies are to assign the sensitive data and the current big data analytics is responsible for providing the data storage and processing facilities with the same priority and do not associate with special actions such as bling processing and encryptions of data. Therefore, if the hacker or the malicious node gains the access to the clusters it would be easy for the hacker to steal, exploit or alter the contained records for malicious purpose. Watercare company also collects customer data for its research purpose in form of questionnaires, behaviours, experiments, to do microtargeting, and service customization. This data of the customers poses a greater risk as the personal information may be disclosed, misused, or used in ways that will adversely affect them in the future. For example, risks of financial loss, identity theft.
Watercare company has adopted notice and consent mechanism to address the privacy issues. The de-identification technique is also applied according to terms of service agreement. For research purposes, the company implemented an extensive review process utilizing privacy controls and explicit and informed consent forms, controlled statistical disclosure, and data use agreement. There is procedure control to limit access to data and its use. The company follows state laws to protect data privacy which is Privacy Act 1993 (New Zealand).
Ethical Concerns: One example of ethical concern that can discussed in water utility company is huge amount of customers GPS data. The issues that can raise is location-based stalking. There are remedies taken by the company for data protection and to safeguard the interest of customers and the society in whole. The Watercare company collects data and stores them on internal servers protected by firewalls and this information is accessible only to authorised staff. The company does not involve trade customer information with third parties to gain monetary benefit. There are many third parties’ websites listed on the company website and if the customer is accessing those website, Watercare has notified its customers to understand the privacy policies of each linked website.
Tableau is an interactive visualization tool helpful in data analysis, thereby giving meaningful insights about the data which is used by the decision makers to run their businesses. Aviation Wildlife Strike data set will be analysed to find the hidden information in the data and an interactive dashboard will be created.
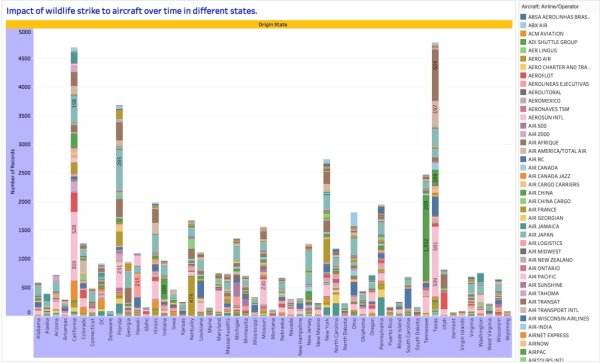
Fig 3.1 Wildlife Strike
To perform this analysis bar chart is used and colour legend is assigned to the Airline operator. The other attributes used in this analysis are Origin state, Impact to flight, Time of day, Aircraft Type and number of wildlife strike, number of records found. For analysis of the impact of the wildlife strikes the two states chosen is Texas and California.
Origin State Texas: In the analysis the maximum number of wildlife strike was one for Southwest Airlines where 920 records. This strike occurred to Airplane during day time, although there was no damage caused. Another observation is on the Military aircraft where the wildlife strike was in the night, and the aircraft had to do precautionary landing.
California: In the analysis the maximum number of wildlife strike was one for Southwest Airlines where 359 records are during night time. This strike occurred to Airplane during night time, although there was no damage caused. Another observation is on the Business Airlines where the wildlife strike was in the night where there were 36 records and one life strike happened and the impact to the aircraft was none.
On analysis of the flight phase, the maximum number of strikes to the aircraft is during the Approach phase. During this phase the flight is within specified airspace and is waiting for further instructions. This increases the chance of bird strike with the aircraft as birds are common on this altitude. One observation on Southwest Airlines during day time, there was one bird strike have 390 records.
Fig 3.2 Strike during phase of time
There a number of bird species moving in the airspace that has caused significant damage to the aircraft monetarily. The most significant damage was caused by unknown bird species of medium size that caused damage totalling $45,329,176.
Fig 3.3 Damage to Aircraft
The dataset has large number of examples that does not belong to the USA country. Filter examples is used to remove these examples. The damage caused by wildlife strike is mentioned in the analysis. The maximum damage is observed in New York for US Airways, where the total cost of damage was $37,948,803 in year 2009.
Fig 3.4 Damage caused to A(n.d.)ircraft in different origin state
This interactive dashboard gives information about the wildlife strike occurring in different state, strikes that happened during the which phase of flight, the specific wildlife species involved in this damage and the cost to the airlines in different origin state. All of this information is contained in a single screen giving the user the freedom to move the cursor around the graphs to find more details.
Fig 3.5 Dashboard
Conclusion: This information is helpful to aviation industry can reduce the damage to their aircraft by altering its flight operations and develop more effective prevention strategies.
Altman, M, Wood, A, O’Brien, DR & Gasser, U 2018, ‘Practical approaches to big data privacy over time’, International Data Privacy Law, vol. 8, no. 1, pp. 29–51.
‘Bangalore Water Taps IBM for Big Data Analytics’ 2014, accessed October 8, 2018, from <https://www-03.ibm.com/press/in/en/pressrelease/43242.wss#resource>.
‘Bird Strike Reporting – SKYbrary Aviation Safety’, accessed October 17, 2018, from <https://www.skybrary.aero/index.php/Bird_Strike_Reporting>.
‘Cyber Security: How Water Utilities Can Protect Against Threats’, accessed October 15, 2018, from <https://www.waterworld.com/articles/wwi/print/volume-32/issue-1/technology-case-studies/cyber-security-how-water-utilities-can-protect-against-threats.html>.
‘Druid |’, accessed September 26, 2018, from <http://druid.io/docs/latest/design/>.
‘Druid | Introducing Druid: Real-Time Analytics at a Billion Rows Per Second’, accessed September 26, 2018, from <http://druid.io/blog/2011/04/30/introducing-druid.html>.
‘Druid | Use Cases’, accessed September 26, 2018, from <http://druid.io/use-cases>.
‘EB7306_IoT_Analytics_Architecture_Time_Series_White_Paper.pdf’, accessed October 8, 2018, from <http://assets.teradata.com/resourceCenter/downloads/AnalystReports/EB7306_IoT_Analytics_Architecture_Time_Series_White_Paper.pdf>.
‘How Dashboards Helps Decision-Makers at Water Utilities’ Valor Water Analytics, accessed October 7, 2018, from <http://www.valorwater.com/blog/2017/7/25/how-dashboards-helps-decision-makers-at-water-utilities>.
‘Manage Data-at-Rest and Deliver Big Data Analytics with Hortonworks Data Platform (HDP)’ Hortonworks, accessed September 25, 2018, from <https://hortonworks.com/products/data-platforms/hdp/>.
Martin, KE 2015, ‘technology, and identifies the ethical issues it faces. These issues arise from reselling’, , p. 19.
‘Meeting the Demand for Data-driven Change in the Utilities Sector’ , p. 12.
‘New Zealand’s official weather forecasts & warnings – Meteorological Service of New Zealand (MetService)’, accessed October 10, 2018, from <https://www.metservice.com/national/home>.
Nikolajeff, J-P ‘Analysis of the Bird Strike Reports Received by the Finnish Transport Safety Agency between the Years 2000 and 201’, , p. 60.
Nowalk, M ‘Precipitation and evaporation’, , p. 7.
Research Ethics and New Forms of Data for Social and Economic Research 2016, accessed October 16, 2018, from <https://www.oecd-ilibrary.org/science-and-technology/research-ethics-and-new-forms-of-data-for-social-and-economic-research_5jln7vnpxs32-en>.
Shahrivari, S 2014, ‘Beyond Batch Processing: Towards Real-Time and Streaming Big Data’, Computers, vol. 3, no. 4, pp. 117–129.
‘The wind across Australia’, accessed October 2, 2018, from <http://www.bom.gov.au/climate/averages/wind/>.
‘Veolia_VIC_Waternamics_Brochure_V5.pdf’, accessed October 4, 2018, from <https://www.veolia.com/anz/sites/g/files/dvc1131/f/assets/documents/2017/07/Veolia_VIC_Waternamics_Brochure_V5.pdf>.
‘Watercare – Privacy policy’, accessed October 7, 2018, from <https://www.watercare.co.nz/Privacy-policy>.
‘WIND DIRECTION AND WEATHER FORECASTING’, accessed October 2, 2018, from <http://www.theweatherprediction.com/habyhints2/432/>.
ZoinerTejada ‘Big data architectures’, accessed September 29, 2018, from <https://docs.microsoft.com/en-us/azure/architecture/data-guide/big-data/>.
Tags: Affordable Academic Writing Services USA, Assignment Help for Master's Students, Online Class and Exam Help, Thesis and Dissertation Writing UKYou Want The Best Grades and That’s What We Deliver
Our top essay writers are handpicked for their degree qualification, talent and freelance know-how. Each one brings deep expertise in their chosen subjects and a solid track record in academic writing.
We offer the lowest possible pricing for each research paper while still providing the best writers;no compromise on quality. Our costs are fair and reasonable to college students compared to other custom writing services.
You’ll never get a paper from us with plagiarism or that robotic AI feel. We carefully research, write, cite and check every final draft before sending it your way.